… Can be Measured (Metrics Dimension)
“Whenever there is fear, you will get wrong figures.”
W. Edwards Deming
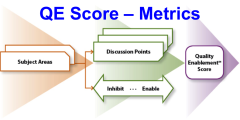
Today, we’ll discuss the details of the Subject Areas and Discussion Points in the Metrics Dimension, and how we use them to calculate this part of the overall QE Score. For a review of the Metrics Dimension, click here.)
As we’ve done previously, I’ve included the weight (e.g. [3]) and guidelines for scores of 1, 4, and 7. Those that are purely inhibiting are tagged with “(inhibiting)” and only have guidelines for 1 & 4; likewise, those that are purely enabling are tagged with “(enabling)” and only have guidelines for 4 & 7.
QE Score Assessment – Metrics Dimension
Metrics Purpose

- Which metrics (if any) are used to track individual performance? (inhibiting) [4]
1 – There are several (more than 3)
4 – None are used to track individual performance
- Which metrics are used to measure system (e.g. customer satisfaction, process, organizational) performance? (enabling) [4]
4 – They all track individual performance
7 – All metrics are focused on continuous improvement
- What other measurements are used? (enabling) [3]
4 – None
7 – Others that focus on organizational improvement / customer satisfaction
- What is done with the metrics results? [3]
1 – Many are used to determine individual performance ratings
4 – Nothing of any substance
7 – Processes are improved
Metrics Definition & Communication

- Are metrics tied to organizational goals? [4]
1 – None are tied to organizational goals
4 – Some are are tied to organizational goals
7 – All are tied to organizational goals
- Is it clear why each reported measurement is needed? [3]
1 – Not at all
4 – We know why some are needed, but not all
7 – Yes, and all involved workers understand that linkage
- Do you know what business questions are being answered by the metrics? [3]
1 – No
4 – Yes for some of them
7 – Yes for all of them
- Do you believe that proper measurements are used to answer the business questions? [3]
1 – No, not at all
4 – Some yes, for others the wrong metrics are being used
7 – Yes, for all of them
- What percent of metrics are objective vs. subjective? [3]
1 – All subjective
4 – About 50:50
7 – All objective
- Are those who are responsible for the processes being measured aware of the results being reported? (inhibiting) [4]
1 – No
4 – Yes, all who are responsible are aware of the metrics
- Have the stakeholders agreed with the reported metrics? [4]
1 – No – metrics are determined by others
4 – Some have, some have not
7 – All stakeholders were involved / agreed to metrics
- For metrics used to measure progress against goals, do you feel that the goals are attainable? [3]
1 – No, the goals are not attainable
4 – Some are, some are not
7 – Yes, and the goals are attainable yet appropriately challenging
Data Collection Process
- To what degree are metrics collected / generated systemically? [4]
1 – All are manually gathered
4 – About a 50:50 mix of manual and automatic
7 – 100% systematically generated
- How much time is spent purely providing data for required data? [2]
1 – More than 10% of team’s time spent purely on data collection
4 – About 5% of team’s time
7 – None
Metrics Presentation

- How much time is spent each week creating metrics-based reports? [3]
1 – More than 10% of team’s time spent purely on metrics data
4 – About 5% of team’s time
7 – None
- How much individual contributor time is used to create metrics reports? [2]
1 – More than 10% of Individual contributors’ time spent purely on metrics data
4 – About 5% of Individual contributors’ time
7 – None
- How much manager time is used to create metrics reports? [3]
1 – More than 10% of managers’ time spent purely on metrics data
4 – About 5% of managers’ time
7 – None
- How much executive time is used to create metrics reports? [4]
1 – More than 10% of executives’ time spent purely on metrics data
4 – About 5% of executives’ time
7 – None
- Do you believe the reported metrics present an accurate picture? [4]
1 – Not at all
4 – Some do, some don’t (50:50)
7 – Yes – very accurate
- Are the reported metrics shared with all stakeholders? [3]
1 – No – many don’t see the metrics data
4 – Some show trends, some don’t (50:50)
7 – Yes, all see the reported metrics
- Do the reported metrics show trends or point-in-time data? [3]
1 – Only point in time
4 – Some do, some don’t (50:50)
7 – Most include trend data
What’s Next
Next week, we’ll continue our QE Score calculation discussion with the 5th Dimension, Agility.
Until Then …
“Agility might be said to be about encountering all the problems so early and so often that the effort to fix them is less than the pain of enduring them.”
Ron Jeffries

What are your thoughts? Please share your comments in the block below.